A Spreadsheet of Posts for WordPress

When Microsoft was working on Excel during the early nineteen nineties, their research indicated that many people did not use spreadsheets for the mathematical tasks (such as financial planning, bookkeeping or simulations) which were the original goals of the spreadsheet genre. Instead, they were used for making lists – grocery shopping, planning parties for their kids, logging project tasks, so on. Microsoft took this research into account and reoriented the functional specifications to make list-making much easier than the competition and previous versions of their own product. Joel Spolsky, who was program manager for Microsoft Excel during this period, states the following.

When we were designing Excel 5.0, the first major release to use serious activity-based planning, we only had to watch about five customers using the product before we realized that an enormous number of people just use Excel to keep lists. They are not entering any formulas or doing any calculation at all! We hadn’t even considered this before. Keeping lists turned out to be far more popular than any other activity with Excel. And this led us to invent a whole slew of features that make it easier to keep lists: easier sorting, automatic data entry, the AutoFilter feature which helps you see a slice of your list, and multi-user features which let several people work on the same list at the same time while Excel automatically reconciles everything.

The Process of Designing a Product, Joel on Software

If you abstract away the specifics of the application, you can easily see that the spreadsheet grid is a one-table database. Having multiple tables can be much more efficient, but a single table is easier to understand for people who do not use databases regularly.

The simplicity of spreadsheets as databases goes beyond just reading.

Adding columns? A database engine needs, at the least, the column name and its data type. In a spreadsheet all you need to do is place the cursor over the first empty cell in the first row and type its name. Filtering is one of the simpler tasks in a database, but spreadsheets even make that easier by providing a dropdown of valid values to choose from. Even inserting new records is much easier in a spreadsheet as compared to a database engine. And more importantly, the grid is a good way of capturing an aggregate view of the entire database and making wholesale changes to groups of records quickly.

A spreadsheet application can be the subject of some really grimy IT horror stories that can involve file shares, multiple users and overwritten records. But if put into a proper data validation framework, the spreadsheet interface is robust and easy to use. Many database management clients use the it to represent their table interface, even for multiple relationships.

Extending to multiple dimensions comes at the cost of some loss of elegance when representing one-to-many relationships. While this UI works, it likely marks the limits of a spreadsheet interface. Nested relationships quickly become difficult to understand. And each nested level can represent only one relationship. It comes as no surprise then that so many database-oriented applications (not the management clients themselves) eschew the spreadsheet interface in favour of a form-driven approach.

But I still think that the spreadsheet interface is vastly underused on the web. As I have mentioned above, it does work for simpler collections of records, such as articles in a content management system or user lists.

Spreadsheet of Posts is a WordPress plugin that aggregates all posts into a spreadsheet interface. While WordPress is a fairly simple to use product for even laypersons, the Post creation process leaves a bit to be desired. The sheer amount of shuffling back and forth between the All Posts and the Edit Posts screen takes away a lot of time. This is similar to the REP loop that interpreted languages provide. The visual difference between two screens is bad enough. To that, the delay caused by network activity, fetching the same data repeatedly from the database, regenerating almost identical markup each time and then rendering it again on the client side increases the effort of getting into the flow. Any boredom while performing such a task is justified.

Spreadsheet of Posts attempts to address these shortcomings by putting all the posts into a grid. Edits are made in-place on the grid itself. New records are inserted by filling in a blank row. Records are deleted by selecting any cell and hitting delete. The record that corresponds to the selected row is deleted. The plugin uses standard page-based navigation to cycle through records that do not fit into a single page. It also provides an alternative to display all the records in a single page. Cell heights can be varied to fit the content, or be set to a fixed constant.
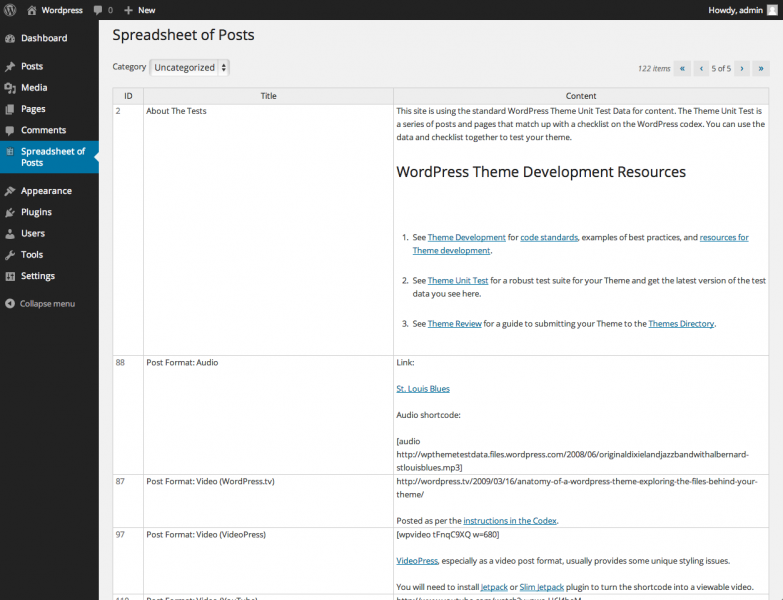
The underlying grid is the Hands on Table jQuery grid editor. While there are more functionally complete alternatives, the interactions and appearance of Hands on Table come closest to replicating Excel. Even the bare bones demo on their home page evokes a lot of familiarity to Microsoft’s product. This is a big necessity to make users more comfortable with Spreadsheet of Posts. The rest of the back end of the plugin uses the standard WordPress framework.

Spreadsheet of Posts is still work in development. A current version can be downloaded from here.
WPF Game of Life

I was introduced to cellular automatons a good decade ago through books written by Peter Small. Back then, we were using Adobe (then Macromedia) Director as our primary development platform, where object-oriented programming was still a bit of a novelty. Small’s writings explained OOP using artificial life forms such as cellular automatons, with Conway’s Game of Life being an oft used concrete example. I was hooked and would spend hours running patterns on a simple implementation of the game that shipped with Windows Entertainment Pack.

But I never got around to implementing the application myself until now. The game has a fairly simple model that does not take much effort to build. This is handy when learning a new platform or language, leaves the programmer free to explore the features of the framework instead of spending cycles trying to nail down the business logic correctly using an unfamiliar language syntax.

Background

There are plenty of resources available online that describe, implement and demonstrate this game. The basic essence of the game is a two-dimensional array of cells and an endless loop that iterates over these cells to update their state depending upon some simple rules.

  1. Any live cell with fewer than two live neighbours dies, as if caused by under-population.
  2. Any live cell with two or three live neighbours lives on to the next generation.
  3. Any live cell with more than three live neighbours dies, as if by overcrowding.
  4. Any dead cell with exactly three live neighbours becomes a live cell, as if by reproduction.

This implementation of the game also consists of the following features for convenience.

  1. Clicking on a cell toggles its state between being alive or dead.
  2. A Randomize button initializes the board by randomly setting the state of all cells to either alive or dead.
  3. A Stop button lets the user stop the cell update iterations in order to observe the arrangement of the board at any given time. This is useful for times when an interesting pattern appears on the screen that seeks further observation.
  4. A Next button complements the Stop button to let the user iterate to progressive generations of the board, one step at a time.

Implementation

This implementation is made up of the following classes.

MainWindow.xaml and MainWindow.xaml.cs

The application window is a XAML class called MainWindow.xaml, which defines the layout of the application. The layout is built around a DockPanel that divides the screen into two – a controller toolbar and the board view.

<DockPanel Name="layout">
    <ToolBar DockPanel.Dock="Top">
        <Button Content="Start" Name="btnStart" Height="23" Width="75" Margin="5" Click="toggleStart_Click" />
        <Button Content="Next" Name="btnNext" Height="23" Width="75" Margin="5" Click="nextIteration_Click" />
        <Button Content="Clear" Name="btnClear" Height="23" Width="75" Margin="5" Click="clear_Click" />
        <Button Content="Randomize" Name="btnRandomize" Height="23" Width="75" Margin="5" Click="randomize_Click" />
    </ToolBar>
    <ScrollViewer HorizontalScrollBarVisibility="Auto" VerticalScrollBarVisibility="Auto">
        <life:BoardView x:Name="view" DockPanel.Dock="Top" Margin="10" Click="view_Click"></life:BoardView>
    </ScrollViewer>
</DockPanel>

The MainWindow class stores a reference to an instance of BoardModel as a private field. Buttons in the toolbar are wired to trigger event handlers in the MainWindow class, which in turn trigger public methods exposed by the model and view instances.

BoardModel.cs

The model class is where the business logic behind the application is implemented. It contains two arrays of bytes of identical length, which store the state of the board in the current iteration and the next iteration. It also initializes a timer that is used to iterate over the board state automatically. In addition, it exposes public methods to control the state of the board – Next(), Start(), Stop(), Clear() and Randomize().

The model instance dispatches an Update event every time the board changes. The window class listens for this event and passes on the contents of the new board cells to the Update() method of the view instance.

BoardView.cs

The view class inherits from System.Windows.FrameworkElement in order to take advantage of its built-in layout functionality. The board is drawn using low-level Visual elements. While it is easier to implement the cell drawing by using Drawings or Shapes, it also adds a lot of overhead for unnecessary features such as styles, data binding, automatic layout and input events. DrawingVisuals provide a much more performant way of drawing large numbers of objects on the screen.

private void DrawCells()
{
    if (null == this.values)
    {
        return;
    }

    using (DrawingContext dc = this.cells.RenderOpen())
    {
        int x = 0;
        int y = 0;
        Rect rect = new Rect(OUTLINE_WIDTH, OUTLINE_WIDTH, Constants.CELL_SIZE - OUTLINE_WIDTH, Constants.CELL_SIZE - OUTLINE_WIDTH);

        for (int i = 0; i &amp;lt; values.Length; i++)
        {
            x = (i % Constants.CELLS_X);
            y = (i / Constants.CELLS_X);
            rect.Location = new Point((x * Constants.CELL_SIZE) + OUTLINE_WIDTH, (y * Constants.CELL_SIZE) + OUTLINE_WIDTH);

            if (1 == values[i])
            {
                dc.DrawRectangle(Brushes.Red, null, rect);
            }
        }
    }
}

One must fetch a reference to a DrawingContext in order to draw content onto a DrawingVisual. This is done through the RenderOpen() method of the DrawingVisual. Since we are only drawing basic rectangles, we can use the in-built DrawRectangle() method of the DrawingContext class to draw this shape for us. Internally, this method still uses a GeometryDrawing and a subclass of the Geometry class, but abstracts away those details for convenience.

The drawing is displayed on the screen by adding the Visual instances to the visual tree of the BoardView class, which is done in its constructor.

public BoardView()
    : base()
{
    this.AddVisualChild(this.grid);
    this.AddLogicalChild(this.grid);

    this.AddVisualChild(this.cells);
    this.AddLogicalChild(this.cells);

    this.visuals = new DrawingVisual[] { this.grid, this.cells };

    this.drawGrid();
    this.drawCells();
}

Additionally, the BoardView class also overrides the VisualChildrenCount, GetVisualChild and MeasureOverride members of the FrameworkElement class.

protected override int VisualChildrenCount
{
    get
    {
        return this.visuals.Length;
    }
}

protected override Visual GetVisualChild(int index)
{
    if (index < 0 || index > this.visuals.Length)
    {
        throw new ArgumentOutOfRangeException("index");
    }

    return this.visuals[index];
}

protected override Size MeasureOverride(Size availableSize)
{
    return new Size(Constants.CELLS_X * Constants.CELL_SIZE, Constants.CELLS_Y * Constants.CELL_SIZE);
}

The BoardView class instance also dispatches an event when the user clicks on a cell on the board. This is in turn passed over to the model instance via the window, causing the model to toggle the state of the cell that was clicked.

ClickEventArgs.cs

An instance of this class is passed as a parameter along with the Click event is dispatched from the BoardView class. It exposes two parameters to identify the X and Y coordinates of the cell which was clicked upon, relative to the board.

The Visual Studio solution for this project can be downloaded from here as a ZIP archive.

A Binary Clock using C#

Bit manipulations are second nature to electronics engineers, embedded programmers and a swathe of engineers who work with low-level systems software such as operating systems, languages and critical frameworks. While it does seem daunting at first, the fundamentals are very simple as explained in my previous post. This post builds upon those concepts to implement a simple binary clock using C#.

The core of the clock is in the BinaryClock class that inherits PictureBox, since this is primarily a visual control and needs a visual context to display its output. Inheriting from PictureBox also makes it easy to use as a drag-and-drop control in the Visual Studio IDE.

BinaryClock consolidates the timekeeping and drawing capabilities into a single class (the OO design crowd may cringe now). An instance of the Timer class ticks every second to invalidate the display and trigger a refresh. The mode field determines the method used to display the clock face – pure binary or binary-coded decimals. Its value can be set from one of the values in the imaginatively-named enum in the same class called Modes.

This brings us to the paint method which is triggered whenever the control has to be redrawn.

void Paint(object sender, PaintEventArgs e)
{
    DateTime dt;
    int h;
    int m;
    int s;
    Rectangle area;
    int offsetX;
    int offsetY;

    dt = DateTime.Now;
    h = dt.Hour;
    m = dt.Minute;
    s = dt.Second;

    area = new Rectangle(0, this.Height - BinaryClock.RECT_SIZE, BinaryClock.RECT_SIZE, BinaryClock.RECT_SIZE);
    offsetX = this._columns * (BinaryClock.RECT_SIZE + BinaryClock.RECT_OFFSET);
    offsetY = BinaryClock.COL_OFFSET;

    // Get bits for the hours component
    this._draw(h, e.Graphics, ref area);
    area.Offset(offsetX, offsetY);

    // Get bits for the minutes component
    this._draw(m, e.Graphics, ref area);
    area.Offset(offsetX, offsetY);

    // Get bits for the seconds component
    this._draw(s, e.Graphics, ref area);
}

This method begins by fetching the current time and extracting its components. Offset values required for the drawing are also initialized depending upon the current display mode. It then makes three calls to the drawing method to draw the appropriate graphics for the hour, minute and second values. Two draw methods are implemented in this class – drawBinary and drawBCD. Both take three parameters – the value to be represented, the Graphics object, and initial position.

Binary Drawing

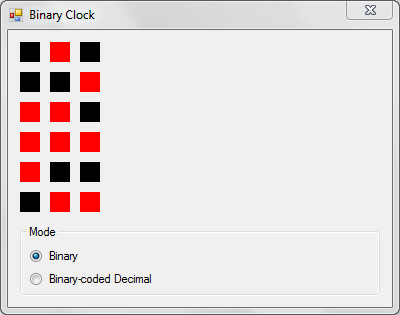
The drawBinary method draws 6 boxes, vertically stacked, in a single column to represent the value in pure binary.

The application running in pure binary mode
for (i = 0; i < 6; i++)
{
    bit = value & (1 << i);

    if (0 == bit)
        g.FillRectangle(_offBrush, area);
    else
        g.FillRectangle(_onBrush, area);

    area.Offset(0, - (BinaryClock.RECT_SIZE + BinaryClock.RECT_OFFSET));
}

The value of each bit in a single number is extracted through the following snippet.

bit = value & (1 << i);

This is an application of testing if the n-th bit is set in a number. The digit 1 (0b00000001) is left-shifted to the position at which the bit in the value is to be inspected, then ANDed with the value.

0b00001010 & 0b00000001 = 0b00000000
0b00001010 & 0b00000010 = 0b00000010
0b00001010 & 0b00000100 = 0b00000000
0b00001010 & 0b00001000 = 0b00001000

The bit has been set if the result is greater than 0.

This is applied in a continuous loop through all the bits in the number. The colour of the box is determined by the value of the bit in that position. Zero is filled with the off colour, and any other value is filled with the on colour.

Binary-coded Decimal

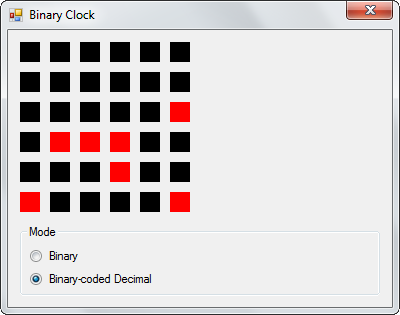
The second function – drawBCD – has the same signature as drawBinary. The only difference is in the way it represents the number on the canvas. Instead of drawing the component value in a single column, it splits it into two decimal digits and draws each digit in its own column. The individual digits are extracted by dividing and modding with 10, then calling the drawBinary function for each digit.

The application running in BCD mode

The Visual Studio solution for this project can be downloaded from here as a ZIP archive.

Creating an Underwater Effect in ActionScript

ActionScript is very well suited to creating old-school demo effects due to its rich drawing API and absence of memory management. Speed would have been a concern a few years ago, but as long as you’re not replicating Heaven7, current releases of Flash player should still be able to handle complex animations with minimal performance problems.

Let me show you a simple wave effect, reminiscing of looking at an object through a wall of water.

Demo effects require a program structure that redraws the entire screen several times every second. The faster the screen refresh, the smoother the resulting animation, at a commensurately higher computation penalty. While traditional languages like C require some kind of a timer mechanism, Flash abstracts away the timers into a frame-rate. We can set up a handler to listen to the ENTER_FRAME event and refresh the screen every time it is triggered.

Demo effects implemented in C often use direct access to the display hardware for performance reasons. Since Flash does not provide direct access to physical devices, we must settle for using the BitmapData class as our drawing buffer and optimize our code within the bounds of its API.

But before we get around to simulating our effect, let us first spend some time understand the principles behind how it is created.

The Sine Wave

A sine wave is mathematical function that plots a smooth, repetitive oscillation and is represented in its simplest form as y(t) = A · sin(ωt + Φ) where A is the amplitude or peak deviation of the function from its centre position, ω is the frequency and specifies how many oscillations occur in a unit time interval in radians per second and Φ is the phase, which specifies where the oscillation cycle begins when t = 0.

With this information we can create a simple function to plot a sine wave.

public function Draw(e:Event):void 
{
    var x1:Number = -1;
    var x2:Number = -1;
    var y1:int = -1;
    var y2:int = -1;
    var amplitude:Number = 120;
    var frequency:Number = 1 * Math.PI / 180; // Convert degree to radians

    for (x1 = 0; x1 < 320; x1++)
    {
        y1 = Math.round(amplitude * Math.sin(frequency * x1)) + 120;
        DrawingUtils.lineBresenham2(this.m_bd, x1, y1, x2, y2, 0xFF000000);
        x2 = x1;
        y2 = y1;
    }
}

[swf]http://www.notadesigner.com/wp-content/uploads/2012/10/wave.swf, 320, 240[/swf]

We use the Bresenham line drawing algorithm instead of setPixel to plot the curve on the bitmap for better fidelity.

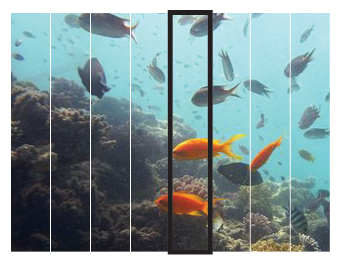
Image A: The image is taller than the red viewport

Creating Waves with Images

The same principles can be used to create a wave effect on an image. Instead of plotting points on a canvas, columns of an image are scaled up or down depending upon the shape of the wave. The image is scaled down at points where the wave forms a crest and scaled up wherever the wave forms a trough.

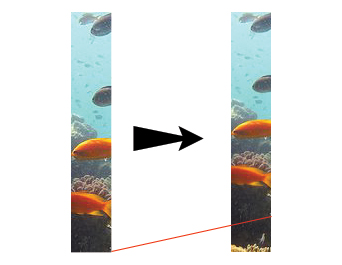
Image B: Extract a single vertical slice
Image C: Scale the extracted portion
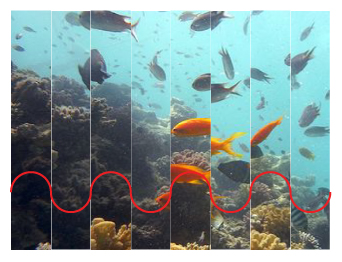
Image D: Paste the slice back into the image

Because of the scaling required, the image we use is larger than the viewable area. Image A illustrates this. The red outline is the viewable area of our movie, whereas the image used is taller than that. If the image is not tall enough you will see white patches at the bottom of the movie when the animation begins.

Each time the screen is to be refreshed, the function cycles over all the columns in the image. The columns are 1 pixel wide in the movie, but for illustration, image B shows the columns as 40 pixels wide. Image C shows how the extracted image column is then scaled down.

When all images are placed next to each other, they appear to make a wave, as shown in image D. While the effect looks very blocky in this illustration due to the wider column widths used, thinner columns used in the final movie give a smoother output.

Further fine-tuning can be done by changing the wavelength of the sine wave. A large value is used in the example below, causing all the columns in the image to shrink and expand at almost the same rate. A smaller value used in its place would have caused a broad discrepancy in the scaling values for each column. Having columns with both large and small values in the same frame would cause a wider range of distortion in the image, and speed up the motion. Effectively, frequency can be used to increase or decrease the speed of the animation, simulating choppy or calm waters as needed.

The function we use is as shown below.

public function Draw(e:Event):void
{
    var img:int;
    var wd:int;
    var y:Number;
    var mx:Matrix;

    for (y = 0; y < 240; y++)
    {
        img = 0; 
        wd = Math.round(Math.sin(aa) * 20) + 320;
        mx = new Matrix();
        mx.scale(1, wd / 320);

        this.m_bd.draw(this.m_rg[img], mx, null, null, new Rectangle(0, y, 320, 1), true);
        aa += 0.01;
    }

    aa = ab;
    ab += 1 * Math.PI / 180;
}

[swf]http://www.notadesigner.com/wp-content/uploads/2012/10/underwater.swf, 320, 240[/swf]

Underwater in Egypt used under CC from http://www.flickr.com/photos/ehole/ / CC BY 2.0

The only difference we need to make in our scaffolding code is to call the Draw effect repeatedly when trying to animate the wave effect, whereas drawing the sine wave can be done by calling the function just once on startup.

The entire codebase with both the effects and scaffolding code is available for download here. To change the effect shown, change the value of the m_fxName variable in Main.as to either SineWave or WaveEffect. New effects can be added by extending the BaseEffect class and changing the value of the m_fxName variable to the newly created class name.

Breaking Free from Your API

I have been noticing off-late that as a UI developer, I dabble less in what can be considered programming and more often in HTML and CSS and making them work across the bazillion browsers out there. The closest I get to what can be considered writing lines of code is where the interaction requires a few lines of JavaScript to transition a control in or out of the screen or some Ajax operation to send data across the wire or update the view. And even such programming is greatly abstracted away, thanks to frameworks such as jQuery. With the browser taking care of everything, from drawing widgets, to layout, to handling user interaction, there is little left to do other than send the page layout to the browser. Sadly, that is the lot of most UI developers who have been reduced to pixel-pushers in this advent of web-based applications.

Even the folks who develop RIAs on platforms such as Flash and Silverlight do not feel the need to get into performance oriented code beyond optimizing network requests.

Don’t worry about widgets. Don’t fiddle with the whatchamacallit. Don’t! Don’t! It is all done! Just fetch me another recordset, sonny. And make it snappy!

And though this kind of work does pay the bills, every once in a while someone runs into a problem that cannot be addressed through an API call. When that happens, the first reaction of the average development team is to clutch at their hair and run around in circles screaming “Omigod! Omigod! Omigod!” And though someone on the team usually manages to whack something out over a weekend, it often isn’t the best solution because nobody has done this before! Whereas programmers of yore that I worked with never flinched at getting their hands dirty with low-level stuff, even up to writing custom extensions to their platform in a language like C, many of today’s programmers work on enough abstractions to make the underlying hardware and operating system entirely irrelevant. To them, the browser or virtual machine is the machine.

Where Does One Draw the Line?

Let me lead you through a programming exercise using ActionScript that demonstrates the joy of extending missing API calls. We are not inventing new algorithms here, but implementing a simple, well-defined solution for drawing lines on raster displays using the slope-intercept formula. Then we are coming up with a better implementation, using a better algorithm, trading performance and accuracy to reach a balanced result in the end.

[swf]http://www.notadesigner.com/wp-content/uploads/2012/10/line.swf, 400, 400[/swf]

The Shape of a Line

For those who do not remember high-school geometry and algebra, a line can be specified by providing its start and end coordinates, using the slope-intercept formula to determine the path between these two points. This information used to be enough to display lines on vector displays of yore, which could draw all sorts of mathematically defined shapes. But with the advent of raster displays which only allow discrete pixels to be turned on, lines and other shapes are now displayed by calculating the pixels which approximate the ideal line as closely as possible.

The slope intercept formula goes as follows –

y = (y1 – y0) / (x1 – x0) * x + b

This is further condensed into –

y = m * x + b

Here m is the slope of the line, which is the ratio of rise against the run. The value b represents the y-intercept, which is the location where the line crosses the origin on the y-axis. So to compute the y-coordinate on any given x-coordinate on that line, you multiply the slope of the line with the x-coordinate and add the y-intercept to the result. To extend this into drawing lines, you would run a loop incrementing a value between the start and end x-coordinates and computing the y-coordinate with each iteration.

Here is an implementation.

public static function lineSimple(bmdCanvas:BitmapData, x0:int, y0:int, x1:int, y1:int, lColor:uint)
{
	/**
	 * Naive implementation of slope-intercept formula
	 */

	var m:Number;
	var b:Number;
	var dx:Number, dy:Number;

	dx = x1 - x0;
	dy = y1 - y0;

	if (dx != 0)
	{
		m = dy / dx;
		b = y0 - m * x0;
		dx = (x1 > x0) ? 1 : -1;

		while (x0 != x1)
		{
			x0 += dx;
			y0 = m * x0 + b;

			bmdCanvas.setPixel32(x0, y0, lColor);
		}
	}
}

This is a very straight-forward implementation and leaves a lot to be desired. But let us take it line by line to understand it.

The first 2 lines calculate the difference between the start and end points in both axes. Then it divides dy by dx after checking for a potential divide by zero error and then calculates the slope and the y-intercept of the line. It also changes the value of dx to 1 if the x-coordinate of the second point is greater than the x-coordinate of the first point, or -1 if it is less than.

We now enter the loop which continues until x0 becomes greater than or equal to x1. Inside this loop it increments the value of x0 by dx (1 or -1) and calculates the value of y0 using the slope-intercept formula. It then places a pixel at the newly calculated coordinate and continues the loop.

This is a very simple implementation and just barely does the job. In fact, it does not even cover all possible cases that a line-drawing function might run into. For example, this will not work correctly if the slope of the line is greater than 1 (in other words, if the line is taller than it is wider). As the loop iterates over values in the x-axis, it plots exactly one pixel in every column while possibly plotting more than one pixel in the same row. But when the line becomes steep, there are fewer columns than rows. Since the algorithm iterates over the x-axis and computes the position in the y-axis, the distance between consecutive pixels on the y-axis increases as the line becomes steeper and makes for a discontinuous line.

Resolution for Slopes Greater than 1 or Negative Slopes

To resolve this issue, with come up with a second iteration of our line drawing function. This function first calculates the slope of the line and if it is less than 1 then it continues using the previously demonstrated algorithm. But if the slope is greater than 1 or less than -1 then it increments the value of the y-axis in the loop and computes the position in the x-axis. The complete implementation is shown below.

public static function lineImproved(bmdCanvas:BitmapData, x0:int, y0:int, x1:int, y1:int, lColor:uint)
{
	/**
	 * Advanced implementation of slope-intercept formula
	 * to handle slopes greater than 1 or less than -1
	 */

	var m:Number;
	var b:Number;
	var dx:Number, dy:Number;

	dx = x1 - x0;
	dy = y1 - y0;

	if (Math.abs(dx) > Math.abs(dy))
	{
		/**
		 * Slope is < 1 or > -1
		 * Increment horizontally
		 */

		m = dy / dx;
		b = y0 - m * x0;
		dx = (x1 > x0) ? 1 : -1;

		while (x0 != x1)
		{
			x0 += dx;
			y0 = m * x0 + b;

			bmdCanvas.setPixel32(x0, y0, lColor);
		}
	}
	else if (dy != 0)
	{
		/*
		 * Slope is > 1 or < -1
		 * Increment vertically
		 */

		m = dx / dy;
		b = x0 - m * y0;
		dy = (dy < 0) ? -1 : 1;

		while (y0 != y1)
		{
			y0 += dy;
			x0 = m * y0 + b;

			bmdCanvas.setPixel32(x0, y0, lColor);
		}
	}
}

This program is essentially the same as the previous one but functionally complete to render lines correctly for all possible cases. But there is plenty of room for optimization. Firstly, it uses floating point numbers for what is eventually to be plotted on screen as pixels, which are in whole numbers. Secondly, it computes the value of the next pixel using the slope-intercept formula. This can be optimized away by pre-calculating this equation once out of the loop and then incrementing the value of the row or column in the loop.

Optimization of Inner Loops

public static function lineDDA(bmdCanvas:BitmapData, x0:int, y0:int, x1:int, y1:int, lColor:uint)
{
	/**
	 * Line drawn using DDA algorithm
	 * Optimizations are made by replacing the repetitive
	 * calculations of the slope-intercept formula in
	 * the loop with 2 division operations outside it
	 * and instead incrementing the values of x and y
	 * variables with these pre-computed numbers
	 * inside the loop
	 */

	var dx:Number, dy:Number;
	var steps:Number;
	var m:Number;
	var x:Number, y:Number;
	var xinc:Number, yinc:Number;

	// Determine the direction of incrementation based on the slope
	dx = x1 - x0;
	dy = y1 - y0;
	if (Math.abs(dx) > Math.abs(dy))
		steps = Math.abs(dx);
	else
		steps = Math.abs(dy);

	// Calculate the incrementation for each axes
	xinc = dx / steps;
	yinc = dy / steps;

	x = x0;
	y = y0;

	for (var i:Number = 1; i < steps; i++)
	{
		x += xinc;
		y += yinc;
		bmdCanvas.setPixel32(x, y, lColor);
	}
}

This algorithm does not use the slope-intercept formula at all. Instead, it calculates the difference between the start and end points and increments the position on both axes in the loop. Whereas calculating the y-coordinate with the slope-intercept formula requires the use of one multiplication and one addition, incrementing the y-coordinate only requires a single addition operation, which makes it blazingly fast.

Further Speed Gains

Floating point operations are desirable for plotting on vector graphics terminals because they are capable for drawing a continuous line. But when using raster displays, which only allow plotting discrete points to approximate a true line, floating point data becomes redundant. Thus, if we can find a way to compute a line using only integers, we can speed up our algorithm, while not losing any substantial information because the pixels used to approximate the line are whole numbers anyway.

Bresenham’s Line Drawing Algorithm uses integers to plot a line on the screen. An implementation is shown below.

public static function lineBresenham2(bmdCanvas:BitmapData, x0:int, y0:int, x1:int, y1:int, lColor:uint)
{
	var dx:int;
	var dy:int;
	var stepx:int
	var stepy:int;
	var counter:int

	// Calculate the difference between the start and end coordinates
	dx = x1 - x0;
	dy = y1 - y0;

	// Determine the direction of the increment in both axes
	if (dx < 0)
	{
		dx = -dx;
		stepx = -1;
	}
	else
	{
		stepx = 1;
	}

	if (dy < 0)
	{
		dy = -dy;
		stepy = -1;
	}
	else
	{
		stepy = 1;
	}

	bmdCanvas.setPixel32(x0, y0, lColor);

	dx <<= 1;
	dy <<= 1;

	if (dx > dy)
	{
		/** Line is wider than it is taller */

		/**
		 * Counter is used to track the number of times
		 * dx is divisible by dy. The value of dy is
		 * repeatedly subtracted from it on every iteration
		 * until it becomes less than or equal to 0.
		 * When that happens, the y-coordinate is incremented
		 * by stepy and counter is reset to dx.
		 */
		counter = dx;

		while (x0 != x1)
		{
			/**
			 * Increment the y-coordinate by stepy when
			 * the counter becomes less than 0
			 */
			if (counter <= 0)
			{
				y0 += stepy;
				counter += dx;
			}

			// Increment the x-coordinate on every iteration
			x0 += stepx;

			// Reduce the counter by dy
			counter -= dy;

			bmdCanvas.setPixel32(x0, y0, lColor);
		}
	}
	else
	{
		/** Line is taller than it is wider */

		counter = dy >> 1;

		while (y0 != y1)
		{
			if (counter <= 0)
			{
				x0 += stepx;
				counter += dy;
			}

			y0 += stepy;
			counter -= dx;

			bmdCanvas.setPixel32(x0, y0, lColor);
		}
	}
}

Division here is implemented as a series of continuous subtractions. The initial value of the variable fraction is set to dx. Assuming that the line is to be plotted from 0,0 to 100, 10, the values of dx and dy are 100 and 10, respectively. Thus, fraction is assigned the value 100. The variables x0 and y0 are the starting coordinates of the line. With each iteration of the loop, x0 is increased by 1 and the value of dy subtracted from fraction. When the fraction becomes less than or equal to 0, the y-coordinate is incremented by 1 and the counter reset to dx. The variable dy can be subtracted from counter dx / dy times before it becomes less than or equal to 0, making it a brute-force form of division.